
Below is a graph of Scotts-MiracleGro actual stock prices superimposed on top of cannabis sales during the COVID-19 time period. As cannabis sales spiked, there was a slight lag and then SMG price spiked. This is because there is a direct correlation between cannabis growing and sales of Scotts-MiracleGro product sales. SMG is the primary supplier to the cannabis industry and when cannabis demand occurs, SMG sales occur right after in order to resupply the nation with cannabis. Cannabis is again experiencing demand, and when those sales are posted, we can expect SMG sales to increase soon.
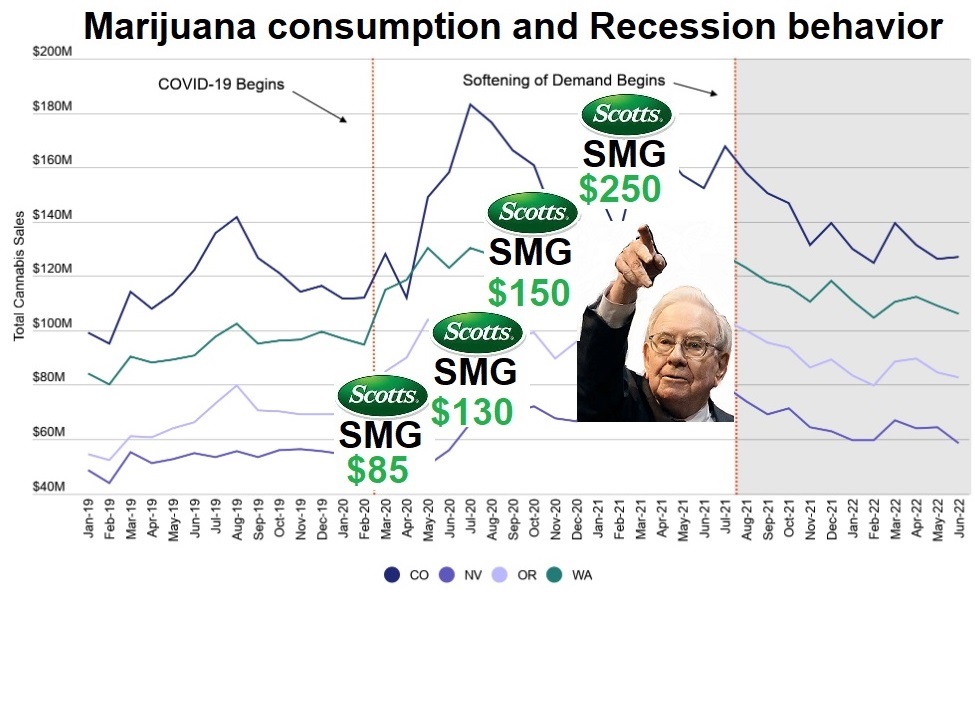
Cannabis is a particular plant, it will only bloom when ratio of sunlight to darkness is 12 hours on and 12 hours off. In nature this occurs only one specific time per year. Most growers of cannabis grow indoors and control this timing with LED grow lights. But more importantly the cannabis plant needs massive doses of very specific combinations of fertilizers at different stages of its growth. Scotts-MiracleGro is the primary distributor of these very specific combinations of fertilizers. When demand occurs in cannabis, sales occurs in SMG product lines.
The United States demand for cannabis is again poised to make a massive unprecedented level of consumption that will cause SMG to rise in share prices above $400.00 as Congress has set the stage for a recession starting in November 2023 and will only deepen in 2024 leading up to the election. Millions of people will be out of work. Many will consume cannabis for a variety of reasons. There is a finite amount of cannabis grown. As the normal amount of production is consumed, growers will need to employ SMG products to ensure their production is as healthy, vibrant and high-yielding as ever before. This will drive the SMG price to highest before seen levels.
CANNABIS RESCHEDULING
The Congress of USA will reschedule Cannabis very soon
Cannabis rescheduling refers to the process of reclassifying cannabis under the controlled substances laws and regulations of a particular country. This typically involves changing the legal status of cannabis from its current classification to a different category, which can have significant implications for its legality, medical use, and regulation.
In many countries, cannabis is classified as a controlled substance and is often listed as a Schedule I or Schedule II drug. These classifications usually mean that cannabis is considered illegal for recreational use and has strict regulations for medical use. Rescheduling can involve moving it to a less restrictive schedule or category, which may have the following effects:
Medical Use: Rescheduling cannabis to a lower schedule can make it easier for doctors to prescribe it for medical purposes. This can result in improved access to cannabis-based medicines for patients suffering from various medical conditions.
Research: Rescheduling can also make it easier for researchers to study cannabis and its potential medical benefits. In many countries, the strict scheduling of cannabis has limited scientific research into its therapeutic properties.
Legalization: In some cases, rescheduling can be a step toward the legalization of cannabis for recreational use. It may involve reducing penalties for possession or cultivation and creating a regulatory framework for legal sales and distribution.
Decriminalization: Rescheduling can also lead to the decriminalization of cannabis, where possession of small amounts is treated as a civil offense rather than a criminal one, resulting in fines or warnings rather than arrest and incarceration
EFFORTS TO DATE
• State-Level Legalization: As of September 2021, numerous U.S. states had legalized cannabis for medical and/or recreational use, despite federal prohibition. State-level legalization created a patchwork of cannabis laws across the country, with varying degrees of regulation and access.
• The MORE Act: In December 2020, the U.S. House of Representatives passed the Marijuana Opportunity Reinvestment and Expungement (MORE) Act. This legislation aimed to decriminalize and de-schedule cannabis at the federal level. It also included provisions for expunging prior cannabis convictions and reinvesting in communities disproportionately affected by the War on Drugs. However, the MORE Act had not passed the U.S. Senate as of my last update.
• Federal Guidance: The Biden administration, which took office in January 2021, signaled a more lenient approach to cannabis policy compared to the previous administration. The Department of Justice issued guidance to federal prosecutors discouraging the pursuit of cannabis-related cases in states where it is legal.
• Rescheduling Efforts: There were ongoing calls from lawmakers, activists, and advocacy groups to reevaluate the Schedule I classification of cannabis and potentially reschedule it to a lower schedule or remove it from the controlled substances list altogether. This would be a significant change in federal cannabis policy.
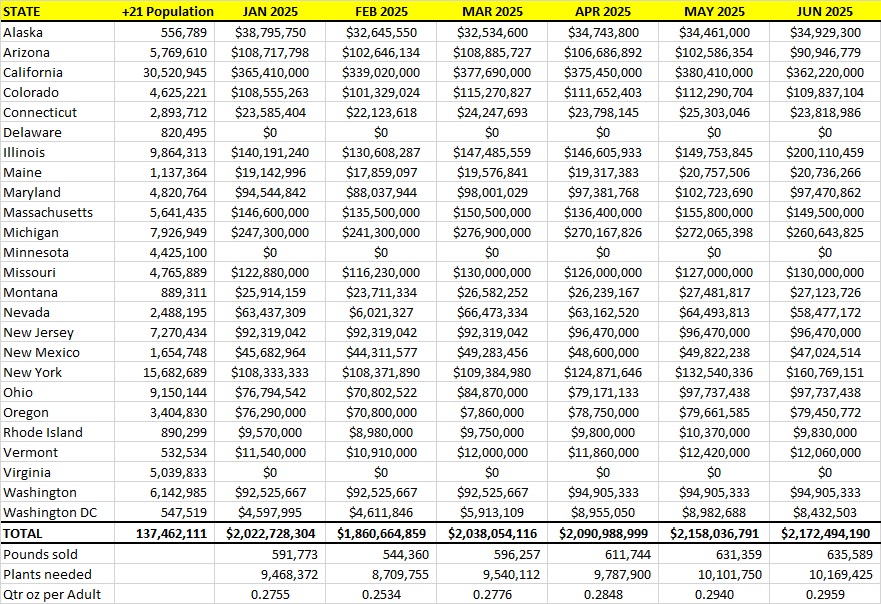
2025 Cannabis Sales Revenues logged by State
2024 Cannabis Sales Revenues logged by State
| STATE | +21 Population | JAN 2024 | FEB 2024 | MAR 2024 | APR 2024 | MAY 2024 | JUN 2024 | JUL 2024 | AUG 2024 | SEP 2024 | OCT 2024 | NOV 2024 | DEC 2024 | TOTAL |
| Alaska | 556,789 | $36,704,241 | $35,245,251 | $36,409,347 | $40,162,473 | $38,138,076 | $35,379,540 | $37,297,125 | $39,403,953 | $38,047,518 | $38,518,110 | $36,794,412 | $32,033,151 | $444,133,197 |
| Arizona | 5,769,610 | $109,695,687 | $113,098,680 | $117,909,203 | $113,491,626 | $109,862,336 | $98,309,955 | $95,659,870 | $95,602,438 | $93,401,050 | $102,571,973 | $100,135,888 | $100,730,009 | $1,250,468,715 |
| California | 30,520,945 | $407,738,989 | $407,738,989 | $407,738,989 | $416,434,636 | $416,434,636 | $416,434,636 | $386,823,330 | $386,823,330 | $386,823,330 | $342,449,754 | $342,449,754 | $342,449,754 | $4,660,340,127 |
| Colorado | 4,625,221 | $115,385,280 | $114,405,355 | $126,630,910 | $120,172,734 | $113,174,488 | $113,764,080 | $122,550,314 | $122,481,188 | $112,429,698 | $113,303,710 | $109,257,837 | $113,576,383 | $1,397,131,976 |
| Connecticut | 2,893,712 | $24,990,208 | $23,677,000 | $24,667,340 | $23,944,720 | $24,713,889 | $23,924,414 | $24,653,220 | $25,664,060 | $23,445,922 | $24,055,147 | $24,411,426 | $25,434,747 | $293,582,093 |
| Delaware | 820,495 | $0 | $0 | $0 | $0 | $0 | $0 | $0 | $0 | $0 | $0 | $0 | $0 | $0 |
| Illinois | 9,864,313 | $133,787,754 | $135,600,000 | $148,900,000 | $144,500,000 | $146,200,000 | $141,800,000 | $143,300,000 | $147,400,000 | $136,500,000 | $142,300,000 | $149,300,000 | $153,200,000 | $1,722,787,754 |
| Maine | 1,137,364 | $16,086,365 | $16,403,925 | $22,316,342 | $17,704,888 | $18,493,270 | $24,072,081 | $21,048,753 | $22,028,364 | $24,682,615 | $20,063,623 | $18,918,662 | $22,058,017 | $243,876,905 |
| Maryland | 4,820,764 | $54,337,444 | $54,337,444 | $54,337,444 | $82,803,744 | $82,803,744 | $82,803,744 | $67,748,237 | $67,748,237 | $67,748,237 | $65,237,556 | $65,237,556 | $65,237,556 | $810,380,944 |
| Massachusetts | 5,641,435 | $135,000,000 | $135,000,000 | $135,000,000 | $135,000,000 | $135,000,000 | $135,000,000 | $142,800,000 | $147,000,000 | $135,000,000 | $135,000,000 | $135,000,000 | $140,200,000 | $1,645,000,000 |
| Michigan | 7,926,949 | $247,000,000 | $259,000,000 | $286,800,000 | $277,000,000 | $274,000,000 | $270,000,000 | $287,700,000 | $295,400,000 | $295,400,000 | $267,600,000 | $276,400,000 | $264,700,000 | $3,301,000,000 |
| Minnesota | 4,425,100 | $0 | $0 | $0 | $0 | $0 | $0 | $0 | $0 | $0 | $0 | $0 | $0 | $0 |
| Missouri | 4,765,889 | $94,760,000 | $98,330,000 | $108,680,000 | $104,580,000 | $108,150,000 | $104,940,000 | $108,580,000 | $111,000,000 | $103,350,000 | $108,560,000 | $113,030,000 | $115,470,000 | $1,279,430,000 |
| Montana | 889,311 | $25,110,065 | $25,091,065 | $26,926,233 | $26,180,026 | $26,934,167 | $26,945,439 | $28,717,104 | $29,716,881 | $27,520,406 | $27,728,562 | $26,708,916 | $26,693,032 | $324,271,896 |
| Nevada | 2,488,195 | $62,462,103 | $82,954,977 | $73,167,470 | $73,075,295 | $69,552,709 | $69,336,192 | $68,161,117 | $78,032,417 | $59,861,972 | $65,000,000 | $66,200,000 | $54,900,000 | $822,704,252 |
| New Jersey | 7,270,434 | $80,755,320 | $80,755,320 | $80,755,320 | $90,018,752 | $90,018,752 | $90,018,752 | $92,508,679 | $92,508,679 | $92,508,679 | $98,036,366 | $98,036,366 | $98,036,366 | $1,083,957,352 |
| New Mexico | 1,654,748 | $46,268,189 | $47,994,956 | $52,507,206 | $51,107,738 | $51,200,881 | $48,072,161 | $50,097,212 | $51,128,193 | $46,821,700 | $48,550,774 | $47,803,036 | $48,821,852 | $590,373,898 |
| New York | 15,682,689 | $72,416,667 | $72,416,667 | $72,416,667 | $72,416,667 | $72,416,667 | $72,416,667 | $72,416,667 | $72,416,667 | $72,416,667 | $72,416,667 | $72,416,667 | $72,416,667 | $869,000,004 |
| Ohio | 9,150,144 | $39,391,890 | $38,400,000 | $54,000,000 | $40,065,722 | $40,936,313 | $38,988,658 | $41,277,148 | $82,065,686 | $76,291,390 | $78,722,153 | $80,640,115 | $84,542,410 | $695,321,485 |
| Oregon | 3,404,830 | $75,704,054 | $76,063,170 | $82,543,445 | $81,536,689 | $82,073,963 | $79,990,768 | $82,260,453 | $84,103,886 | $78,624,372 | $79,730,888 | $78,644,917 | $78,744,920 | $960,021,525 |
| Rhode Island | 890,299 | $9,500,000 | $9,390,000 | $10,150,000 | $9,770,000 | $10,080,000 | $9,680,000 | $10,080,000 | $10,250,000 | $9,520,000 | $9,790,000 | $9,990,000 | $10,110,000 | $118,310,000 |
| Vermont | 532,534 | $10,420,000 | $10,660,000 | $11,440,000 | $11,380,000 | $11,470,000 | $11,370,000 | $12,370,000 | $13,150,000 | $12,060,000 | $11,890,000 | $11,210,000 | $11,820,000 | $139,240,000 |
| Virginia | 5,039,833 | $0 | $0 | $0 | $0 | $0 | $0 | $0 | $0 | $0 | $0 | $0 | $0 | $0 |
| Washington | 6,142,985 | $97,588,667 | $97,588,667 | $97,588,667 | $99,537,000 | $99,537,000 | $99,537,000 | $100,556,333 | $100,556,333 | $100,556,333 | $98,916,333 | $98,916,333 | $98,916,333 | $1,189,795,000 |
| Washington DC | 547,519 | $24,100,000 | $22,955,133 | $24,199,050 | $25,830,517 | $25,085,817 | $25,700,183 | $25,017,817 | $25,430,800 | $23,484,350 | $25,046,667 | $26,789,633 | $26,339,800 | $299,979,767 |
| TOTAL | 137,462,111 | $1,919,202,923 | $1,957,106,599 | $2,055,083,633 | $2,056,713,227 | $2,046,276,708 | $2,018,484,271 | $2,021,623,379 | $2,099,911,112 | $2,016,494,239 | $1,975,488,283 | $1,988,291,519 | $1,986,430,997 | $24,141,106,890 |
| Pounds sold | 561,486 | 572,575 | 601,239 | 601,716 | 598,663 | 590,532 | 591,450 | 614,354 | 589,949 | 577,953 | 581,698 | 581,154 | 7,062,768 | |
| Plants needed | 8,983,771 | 9,161,197 | 9,619,827 | 9,627,455 | 9,578,602 | 9,448,506 | 9,463,200 | 9,829,664 | 9,439,190 | 9,247,242 | 9,307,174 | 9,298,465 | 113,004,292 | |
| Qtr oz per Adult | 0.2614 | 0.2666 | 0.2799 | 0.2801 | 0.2787 | 0.2749 | 0.2754 | 0.2860 | 0.2747 | 0.2691 | 0.2708 | 0.2706 | 3.2883 |
2024 Cannabis Sales Revenues logged in Canada
| TERRITORY | +21 Population | JAN 2024 | FEB 2024 | MAR 2024 | APR 2024 | MAY 2024 | JUN 2024 | JUL 2024 | AUG 2024 | SEP 2024 | OCT 2024 | NOV 2024 | DEC 2024 | TOTAL |
| Newfoundland | 430,221 | $7,465,000 | $7,080,000 | $7,454,000 | $7,688,000 | $7,994,000 | $7,893,000 | $8,617,000 | $9,489,000 | $8,202,000 | $8,642,000 | $8,431,000 | $9,953,000 | $98,908,000 |
| Prince Edward Island | 136,141 | $2,079,000 | $1,908,000 | $2,069,000 | $2,067,000 | $2,121,000 | $2,148,000 | $2,412,000 | $2,498,000 | $2,136,000 | $2,238,000 | $2,115,000 | $2,307,000 | $26,098,000 |
| Nova Scotia | 829,932 | $10,412,000 | $9,361,000 | $10,034,000 | $8,118,000 | $10,475,000 | $10,316,000 | $10,786,000 | $11,310,000 | $10,016,000 | $10,718,000 | $10,253,000 | $11,380,000 | $123,179,000 |
| New Bruswick | 656,014 | $7,410,000 | $7,030,000 | $7,710,000 | $6,364,000 | $8,040,000 | $8,185,000 | $8,672,000 | $9,495,000 | $8,215,000 | $8,223,000 | $8,107,000 | $8,924,000 | $96,375,000 |
| Quebec | 6,904,013 | $54,162,000 | $52,509,000 | $53,777,000 | $56,662,000 | $62,450,000 | $63,570,000 | $64,841,000 | $61,807,000 | $58,377,000 | $53,910,000 | $51,753,000 | $56,971,000 | $690,789,000 |
| Ontario | 11,972,019 | $156,804,000 | $145,735,000 | $154,895,000 | $163,834,000 | $155,070,000 | $158,274,000 | $166,946,000 | $186,258,000 | $179,845,000 | $177,558,000 | $180,987,000 | $201,298,000 | $2,027,504,000 |
| Manitoba | 1,062,020 | $17,449,000 | $16,724,000 | $16,557,000 | $18,972,000 | $18,207,000 | $18,423,000 | $18,797,000 | $19,549,000 | $19,368,000 | $19,779,000 | $20,326,000 | $21,616,000 | $225,767,000 |
| Sascatchewan | 890,491 | $15,910,000 | $14,213,000 | $13,073,000 | $13,336,000 | $12,793,000 | $16,918,000 | $18,553,000 | $17,044,000 | $16,016,000 | $16,238,000 | $18,114,000 | $19,216,000 | $191,424,000 |
| Alberta | 3,445,790 | $73,785,000 | $72,070,000 | $76,711,000 | $63,716,000 | $77,781,000 | $81,203,000 | $80,952,000 | $82,670,000 | $78,079,000 | $82,685,000 | $79,661,000 | $94,962,000 | $944,275,000 |
| British Columbia | 4,314,694 | $54,496,000 | $58,186,000 | $62,249,000 | $67,397,000 | $56,289,000 | $64,274,000 | $70,002,000 | $73,016,000 | $68,760,000 | $68,088,000 | $71,959,000 | $70,012,000 | $784,728,000 |
| Yukon | 34,446 | $973,000 | $968,000 | $1,107,000 | $1,105,000 | $1,179,000 | $1,215,000 | $1,329,000 | $1,383,000 | $1,246,000 | $1,227,000 | $1,181,000 | $1,406,000 | $14,319,000 |
| Northwest Territories | 33,953 | $500,000 | $500,000 | $500,000 | $500,000 | $500,000 | $500,000 | $500,000 | $500,000 | $500,000 | $500,000 | $500,000 | $500,000 | $6,000,000 |
| Nunavut | 24,620 | $500,000 | $500,000 | $500,000 | $500,000 | $500,000 | $500,000 | $500,000 | $500,000 | $500,000 | $500,000 | $500,000 | $500,000 | $6,000,000 |
| TOTAL | 30,734,354 | $401,945,000 | $386,784,000 | $406,636,000 | $410,259,000 | $413,399,000 | $433,419,000 | $452,907,000 | $475,519,000 | $451,260,000 | $450,306,000 | $453,887,000 | $499,045,000 | $5,235,366,000 |
| Pounds sold | 132,848 | 127,837 | 134,398 | 135,596 | 136,634 | 143,251 | 149,692 | 157,165 | 149,147 | 148,832 | 150,016 | 164,941 | 1,730,356 | |
| Plants needed | 2,125,568 | 2,045,394 | 2,150,375 | 2,169,535 | 2,186,140 | 2,292,010 | 2,395,066 | 2,514,643 | 2,386,356 | 2,381,311 | 2,400,249 | 2,639,053 | 27,685,701 | |
| Qtr oz per Adult | 0.2766 | 0.2662 | 0.2799 | 0.2824 | 0.2845 | 0.2983 | 0.3117 | 0.3273 | 0.3106 | 0.3099 | 0.3124 | 0.3435 | 3.6032 |
2023 Cannabis Sales Revenues logged by State
| STATE | +21 Population | JAN 2023 | FEB 2023 | MAR 2023 | APR 2023 | MAY 2023 | JUN 2023 | JUL 2023 | AUG 2023 | SEP 2023 | OCT 2023 | NOV 2023 | DEC 2023 | TOTAL |
| Alaska | 556,789 | $29,688,640 | $27,439,680 | $31,580,480 | $29,256,640 | $28,847,040 | $28,342,400 | $26,595,200 | $31,749,440 | $29,730,560 | $30,663,680 | $27,335,360 | $27,822,400 | $349,051,520 |
| Arizona | 5,769,610 | $121,018,508 | $120,260,153 | $133,979,377 | $124,746,381 | $119,745,011 | $115,131,861 | $107,772,106 | $114,428,653 | $107,035,487 | $108,246,982 | $105,498,359 | $111,276,514 | $1,389,139,392 |
| California | 30,520,945 | $426,329,941 | $426,329,941 | $426,329,941 | $438,860,901 | $438,860,901 | $438,860,901 | $417,566,084 | $417,566,084 | $417,566,084 | $344,118,359 | $337,854,224 | $358,105,806 | $4,888,349,167 |
| Colorado | 4,625,221 | $129,370,166 | $124,848,177 | $139,621,230 | $131,556,804 | $126,062,183 | $131,285,800 | $137,325,587 | $132,447,967 | $127,985,531 | $122,673,117 | $110,344,601 | $101,099,341 | $1,514,620,504 |
| Connecticut | 2,893,712 | $13,173,644 | $18,466,142 | $22,139,154 | $21,626,988 | $22,774,710 | $23,906,584 | $23,627,730 | $24,938,642 | $25,203,738 | $24,800,000 | $26,000,000 | $27,500,000 | $274,157,332 |
| Delaware | $0 | $0 | $0 | $0 | $0 | $0 | $0 | $0 | $0 | $0 | $0 | $0 | $0 | |
| Illinois | 9,864,313 | $127,938,020 | $120,488,570 | $134,790,382 | $131,990,503 | $132,777,299 | $136,408,412 | $140,048,722 | $139,224,010 | $139,529,179 | $164,996,013 | $164,682,443 | $181,800,000 | $1,714,673,553 |
| Maine | 1,137,364 | $14,250,352 | $14,489,051 | $16,703,763 | $16,380,315 | $17,369,773 | $18,617,726 | $21,001,644 | $21,756,765 | $20,347,890 | $18,999,622 | $17,648,333 | $19,307,988 | $216,873,222 |
| Maryland | 4,820,764 | $37,966,817 | $37,701,563 | $42,301,162 | $39,942,732 | $40,781,021 | $42,697,446 | $87,998,406 | $91,815,857 | $90,970,598 | $90,025,475 | $89,669,855 | $96,481,597 | $788,352,529 |
| Massachusetts | 5,641,435 | $127,146,597 | $127,146,597 | $127,146,597 | $127,146,597 | $127,146,597 | $134,000,000 | $137,100,000 | $139,900,000 | $134,700,000 | $131,500,000 | $138,576,015 | $158,700,000 | $1,610,209,000 |
| Michigan | 7,926,949 | $207,304,079 | $216,389,046 | $249,674,217 | $246,054,243 | $245,919,259 | $260,797,011 | $276,746,264 | $276,262,398 | $274,728,596 | $262,891,204 | $260,500,000 | $279,900,000 | $3,057,166,317 |
| Minnesota | 4,425,100 | $0 | $0 | $0 | $0 | $0 | $0 | $7,000,000 | $8,400,000 | $15,400,000 | ||||
| Missouri | 4,765,889 | $37,000,000 | $102,900,000 | $126,200,000 | $121,100,000 | $120,900,000 | $121,200,000 | $123,200,000 | $119,000,000 | $117,800,000 | $113,100,000 | $112,700,000 | $123,300,000 | $1,338,400,000 |
| Montana | 889,311 | $24,946,537 | $24,530,061 | $27,098,679 | $25,817,355 | $26,096,828 | $26,935,335 | $28,552,001 | $28,697,312 | $28,159,456 | $26,260,538 | $25,186,590 | $26,886,443 | $319,167,135 |
| Nevada | 2,488,195 | $70,254,611 | $67,814,368 | $75,023,166 | $72,083,328 | $72,685,112 | $68,588,014 | $71,615,363 | $69,503,165 | $68,562,873 | $67,921,099 | $61,478,753 | $62,935,147 | $828,464,999 |
| New Jersey | 7,270,434 | $59,773,992 | $59,773,992 | $59,773,992 | $64,362,936 | $64,362,936 | $64,362,936 | $68,666,667 | $68,666,667 | $68,666,667 | $73,479,494 | $73,479,494 | $73,479,494 | $798,849,267 |
| New Mexico | 1,654,748 | $40,302,534 | $41,726,976 | $47,867,662 | $46,200,784 | $45,845,682 | $47,844,697 | $48,018,031 | $48,313,949 | $47,234,725 | $46,682,243 | $46,515,534 | $50,466,986 | $557,019,803 |
| New York | 15,682,689 | $2,200,000 | $2,800,000 | $3,800,000 | $7,500,000 | $6,700,000 | $8,900,000 | $16,000,000 | $17,000,000 | $21,400,000 | $17,900,000 | $18,800,000 | $27,000,000 | $150,000,000 |
| Oregon | 3,404,830 | $75,643,654 | $72,866,875 | $83,096,371 | $82,275,388 | $79,289,712 | $80,585,168 | $82,090,586 | $81,766,730 | $80,358,759 | $78,779,256 | $76,909,670 | $81,332,264 | $954,994,433 |
| Rhode Island | 890,299 | $7,384,697 | $7,443,219 | $8,741,429 | $8,421,924 | $8,892,594 | $9,170,619 | $9,465,617 | $9,672,793 | $9,633,352 | $9,430,642 | $9,193,065 | $10,216,190 | $107,666,141 |
| Vermont | 532,534 | $6,040,000 | $6,600,000 | $7,850,000 | $7,860,000 | $8,420,000 | $8,990,000 | $9,830,000 | $10,370,000 | $9,660,000 | $9,743,900 | $8,902,700 | $94,266,600 | |
| Virginia | $0 | $0 | $0 | $0 | $0 | $0 | $0 | $0 | $0 | $0 | $0 | $0 | $0 | |
| Washington | 6,142,985 | $115,000,000 | $115,000,000 | $115,000,000 | $115,000,000 | $115,000,000 | $115,000,000 | $115,000,000 | $115,000,000 | $115,000,000 | $115,000,000 | $115,000,000 | $115,000,000 | $1,380,000,000 |
| Washington DC | 547,519 | $5,045,858 | $4,775,081 | $5,824,991 | $5,869,022 | $5,486,093 | $5,066,665 | $4,667,151 | $4,732,772 | $4,469,929 | $45,937,562 | |||
| TOTAL | 122,451,638 | $1,677,778,647 | $1,739,789,492 | $1,884,542,593 | $1,864,052,841 | $1,853,962,751 | $1,886,691,575 | $1,959,887,159 | $1,971,213,204 | $1,938,743,424 | $1,857,211,624 | $1,826,274,996 | $1,932,610,170 | $22,392,758,477 |
| Pounds sold | 490,854 | 508,996 | 551,345 | 545,351 | 542,399 | 551,974 | 573,388 | 576,702 | 567,202 | 543,349 | 534,298 | 565,408 | 6,551,268 | |
| Plants needed | 7,853,666 | 8,143,938 | 8,821,526 | 8,725,614 | 8,678,382 | 8,831,585 | 9,174,213 | 9,227,230 | 9,075,240 | 8,693,590 | 8,548,776 | 9,046,530 | 104,820,290 | |
| Qtr oz per Adult | 0.2565 | 0.2660 | 0.2882 | 0.2850 | 0.2835 | 0.2885 | 0.2997 | 0.3014 | 0.2965 | 0.2840 | 0.2793 | 0.2955 | 3.4241 |
2023 Cannabis Sales Revenues logged in Canada
| TERRITORY | +21 Population | JAN 2023 | FEB 2023 | MAR 2023 | APR 2023 | MAY 2023 | JUN 2023 | JUL 2023 | AUG 2023 | SEP 2023 | OCT 2023 | NOV 2023 | DEC 2023 | TOTAL |
| Newfoundland | 430,221 | $6,000,000 | $5,600,000 | $6,100,000 | $6,000,000 | $6,300,000 | $6,634,000 | $7,192,000 | $7,600,000 | $7,219,000 | $7,340,000 | $6,997,000 | $7,883,000 | $80,865,000 |
| Prince Edward Island | 136,141 | $1,700,000 | $1,700,000 | $1,900,000 | $1,900,000 | $1,200,000 | $1,983,000 | $2,267,000 | $2,300,000 | $2,035,000 | $2,142,000 | $2,010,000 | $2,212,000 | $23,349,000 |
| Nova Scotia | 829,932 | $9,000,000 | $8,500,000 | $9,500,000 | $9,100,000 | $9,600,000 | $9,814,000 | $10,322,000 | $10,600,000 | $10,777,000 | $10,175,000 | $9,610,000 | $10,994,000 | $117,992,000 |
| New Bruswick | 656,014 | $6,500,000 | $6,100,000 | $6,200,000 | $6,800,000 | $7,100,000 | $7,572,000 | $7,686,000 | $8,500,000 | $7,732,000 | $7,523,000 | $7,536,000 | $8,394,000 | $87,643,000 |
| Quebec | 6,904,013 | $49,500,000 | $45,100,000 | $50,700,000 | $48,600,000 | $52,500,000 | $53,368,000 | $54,419,000 | $55,900,000 | $53,339,000 | $57,459,000 | $52,099,000 | $49,374,000 | $622,358,000 |
| Ontario | 11,972,019 | $155,000,000 | $141,800,000 | $158,900,000 | $161,200,000 | $162,500,000 | $167,832,000 | $176,081,000 | $188,500,000 | $175,454,000 | $177,772,500 | $154,536,000 | $184,277,000 | $2,003,852,500 |
| Manitoba | 1,062,020 | $16,800,000 | $16,700,000 | $15,900,000 | $15,900,000 | $16,000,000 | $16,429,000 | $16,677,000 | $15,400,000 | $16,572,000 | $18,763,000 | $17,225,000 | $18,716,000 | $201,082,000 |
| Sascatchewan | 890,491 | $19,100,000 | $17,500,000 | $18,700,000 | $19,000,000 | $19,200,000 | $19,547,000 | $19,844,000 | $20,500,000 | $19,550,000 | $17,729,000 | $14,534,000 | $15,995,000 | $221,199,000 |
| Alberta | 3,445,790 | $69,500,000 | $65,000,000 | $72,300,000 | $72,600,000 | $74,300,000 | $75,167,000 | $78,533,000 | $78,600,000 | $76,459,000 | $76,481,000 | $73,658,000 | $82,006,000 | $894,604,000 |
| British Columbia | 4,314,694 | $60,600,000 | $55,900,000 | $63,400,000 | $68,500,000 | $64,800,000 | $65,991,000 | $70,773,000 | $73,900,000 | $72,719,000 | $70,944,000 | $67,510,000 | $59,009,000 | $794,046,000 |
| Yukon | 34,446 | $843,000 | $788,000 | $925,000 | $925,000 | $996,000 | $10,990,000 | $1,170,000 | $1,300,000 | $1,175,000 | $1,127,000 | $1,012,000 | $1,152,000 | $22,403,000 |
| Northwest Territories | 33,953 | $500,000 | $500,000 | $500,000 | $600,000 | $600,000 | $600,000 | $600,000 | $600,000 | $600,000 | $600,000 | $600,000 | $600,000 | $6,900,000 |
| Nunavut | 24,620 | $500,000 | $500,000 | $500,000 | $600,000 | $600,000 | $600,000 | $600,000 | $600,000 | $600,000 | $600,000 | $600,000 | $600,000 | $6,900,000 |
| TOTAL | 30,734,354 | $395,543,000 | $365,688,000 | $405,525,000 | $411,725,000 | $415,696,000 | $436,527,000 | $446,164,000 | $464,300,000 | $444,231,000 | $448,655,500 | $407,927,000 | $441,212,000 | $5,083,193,500 |
| Pounds sold | 130,732 | 120,865 | 134,031 | 136,080 | 137,393 | 144,278 | 147,463 | 153,457 | 146,824 | 148,286 | 134,825 | 145,826 | 1,680,061 | |
| Plants needed | 2,091,713 | 1,933,834 | 2,144,500 | 2,177,287 | 2,198,287 | 2,308,445 | 2,359,408 | 2,455,315 | 2,349,186 | 2,372,583 | 2,157,203 | 2,333,221 | 26,880,981 | |
| Qtr oz per Adult | 0.2722 | 0.2517 | 0.2791 | 0.2834 | 0.2861 | 0.3004 | 0.3071 | 0.3196 | 0.3057 | 0.3088 | 0.2808 | 0.3037 | 3.4985 |
Both Canada and USA consumption is at a quarter ounce bag consumed by one out of every three adults (+21) each month where cannabis is legal to consume recreationally. Those are rookie numbers, the proverbial two smokes a night is a quarter ounce bag every week. Consumption statistics are only increasing every month on about a 2% rate of increase each month. When every adult is consuming two joints a day, the 0.3 number will be closer to a 4.0
These statistics brought to you by a
Logistics Manager

Rob Scott
(click the picture for the resume)
Fertilizer must be replaced grow after grow, if increasing production you need even more
A cannabis plant yields an ounce of product
10 million plants required every month to produce 646,509 pounds of product
Roughly 30.8 million plants required per quarter at present demand for cannabis
THAT'S 30.8 MILLION OF EACH OF THESE:
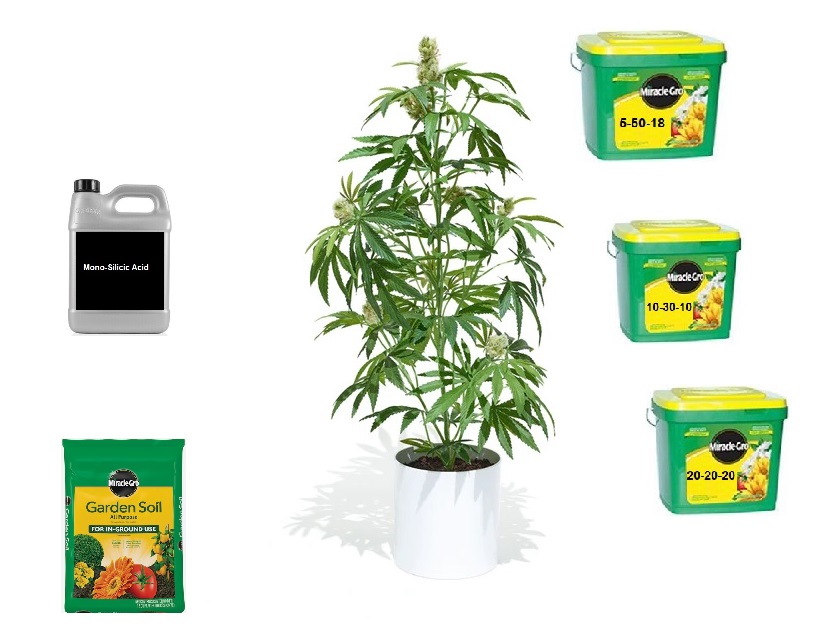
These inputs described in these books


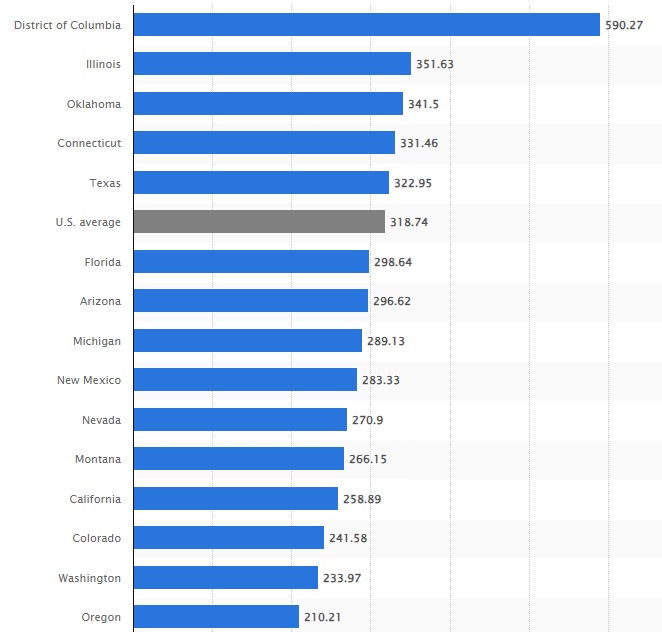
The Wholesale price per pound of Cannabis
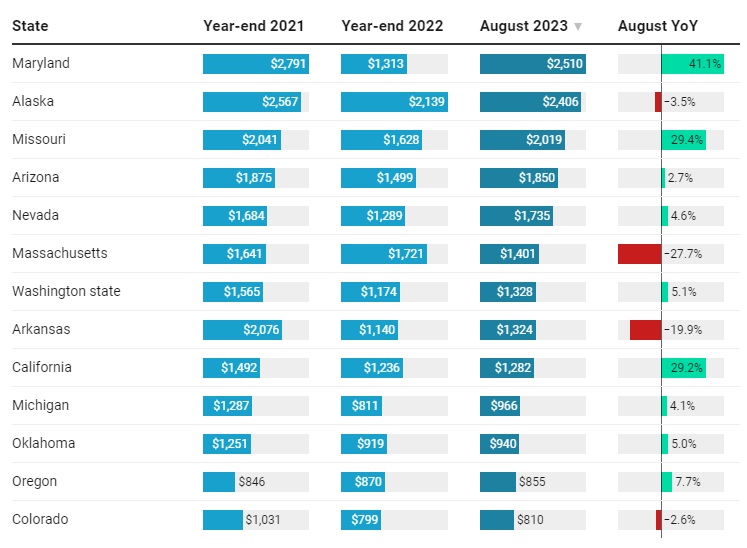
The Retail price per ounce of Cannabis
30.8 million sales of inputs at retail level, because most of the 14,365 cultivators/growers are very small operations, growing about 400 plants at a time, averaging 30 pounds of finished product each month. The inputs are purchased at the retail level at this small volume. Miracle-Gro/Hawthorne unit is not actively marketing to small growers who do not buy in bulk, instead these growers are purchasing at retail prices and volumes. These sales show up as lagged indicators of SMG sales figures, they are under-forecasted because as Cannabis sales are posted, the inputs are being purchased to grow the next batches of Cannabis.
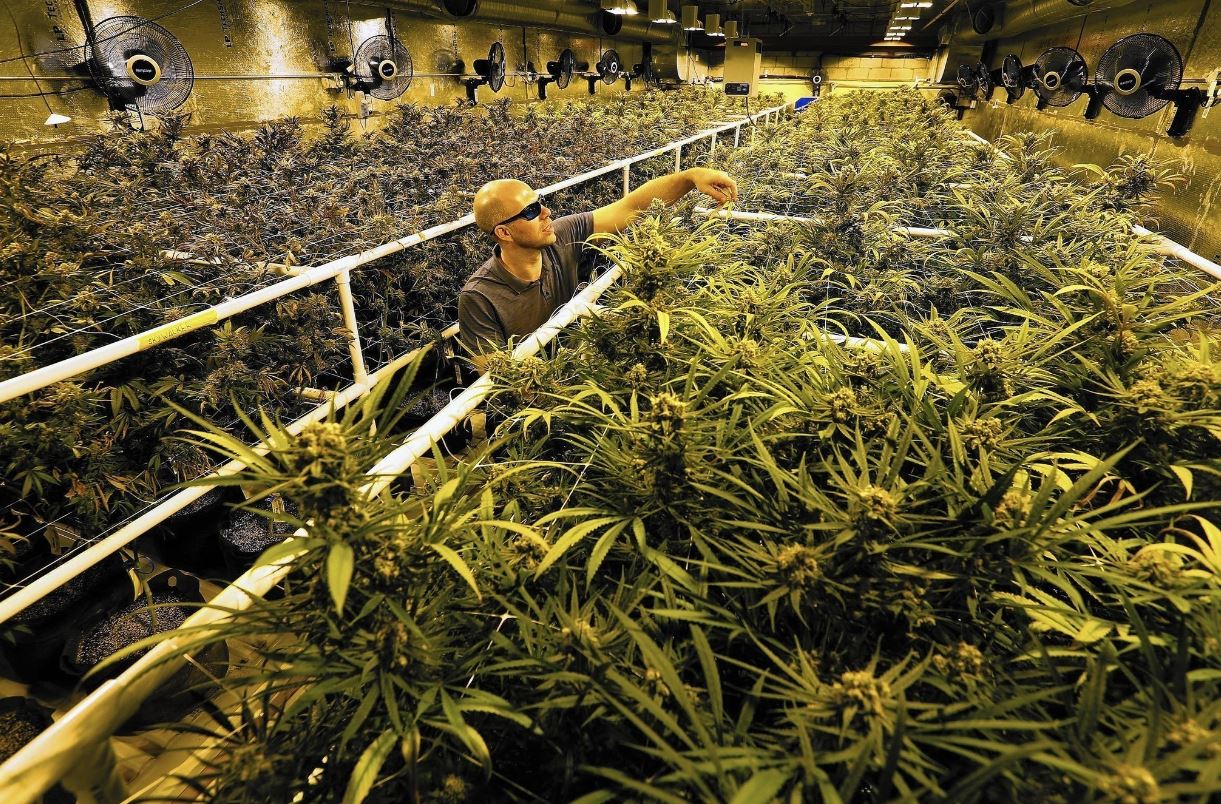
Most people think of Cannabis grow operations like this.
But this is rare, but right for Hawthorne division products sales
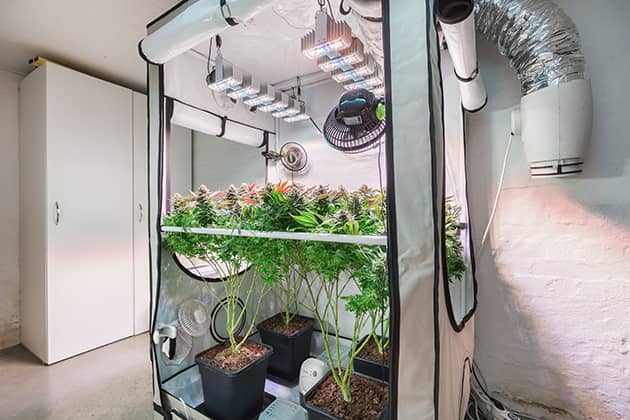
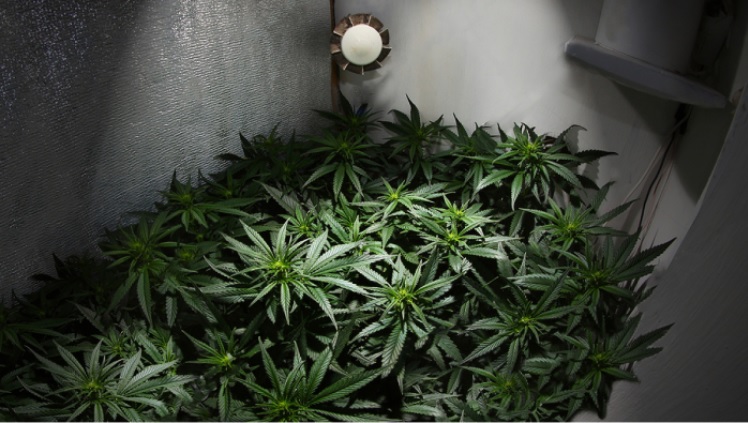
This is what 99% of Cannabis grow operations actually look like.
Miracle-Gro retail sales support these typical one-bedroom grows
Developments in cannabis policy are changing rapidly, and the status of cannabis rescheduling in the United States will cause SMG stock price to increase very rapidly. Just a small increase in cannabis demand will cause SMG product consumption to increase dramatically.